
How to connect Google Analytics 4 to PowerBI
You’re trying to connect your Google Analytics 4 data to PowerBI and you’re still struggling ? Here is how to do it. You have several ways to connect GA4 to PowerBI Desktop, we will focus on 3 of them.
Direct Connection :
The first way to do it is by direct connection between the two tools :
Open Power BI Desktop and navigate to the Home tab.
Click on Get Data and type “Google Analytics”
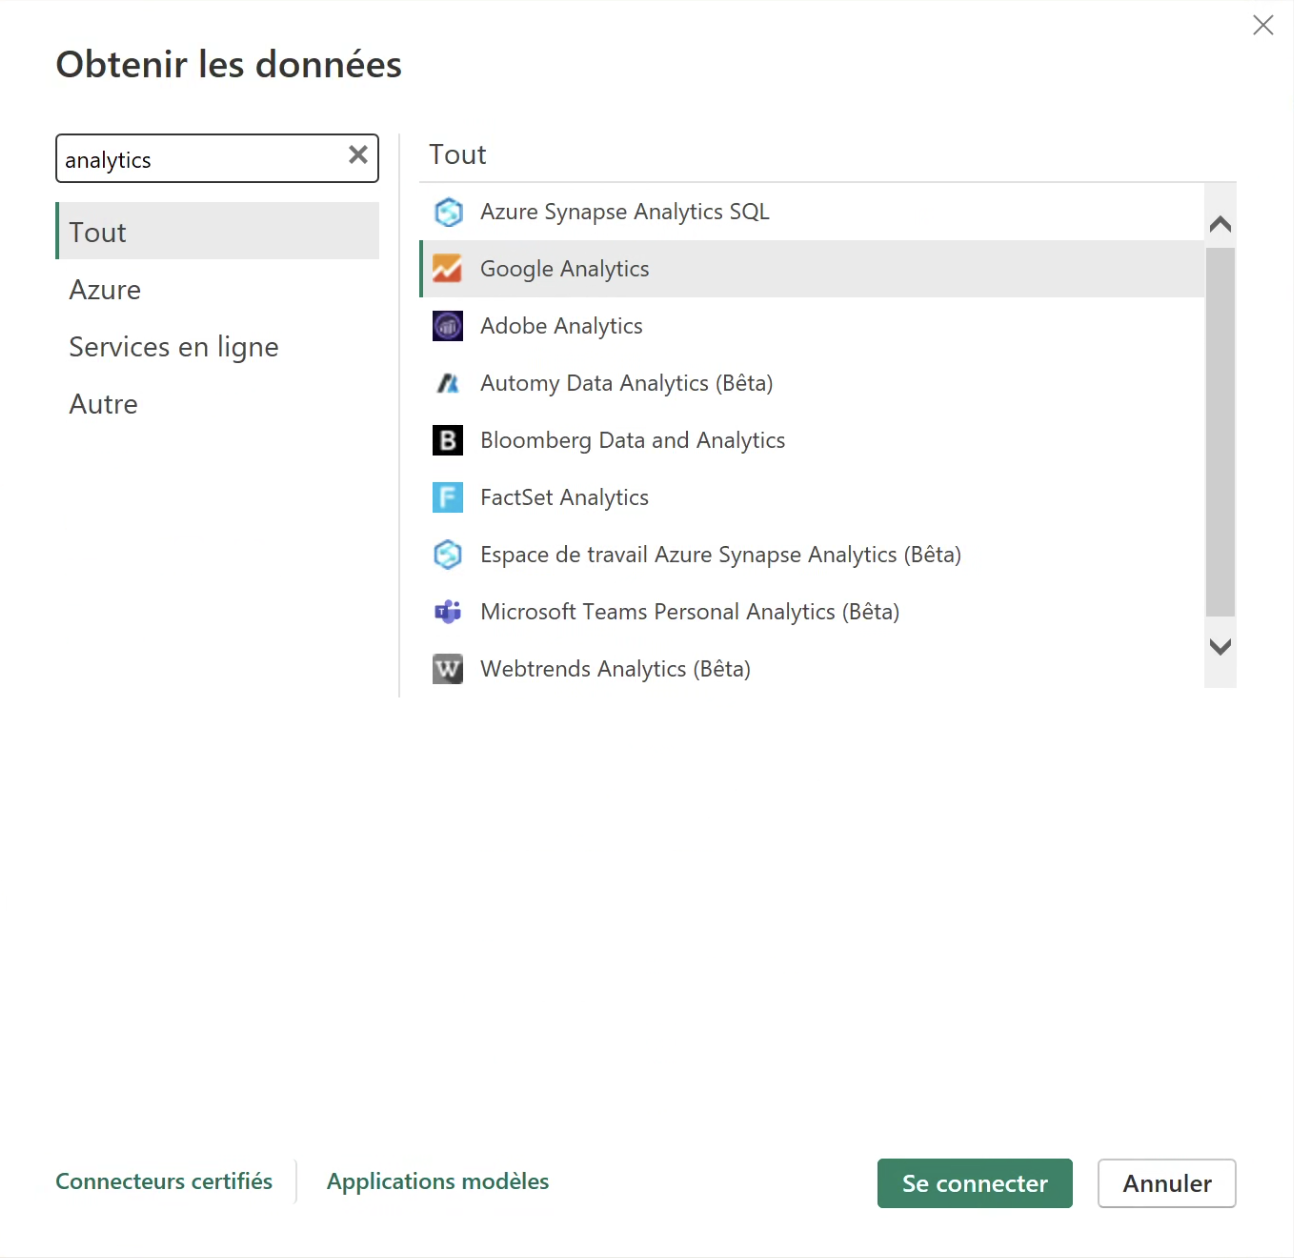
3. Click on Connect and sign in with your Google account.
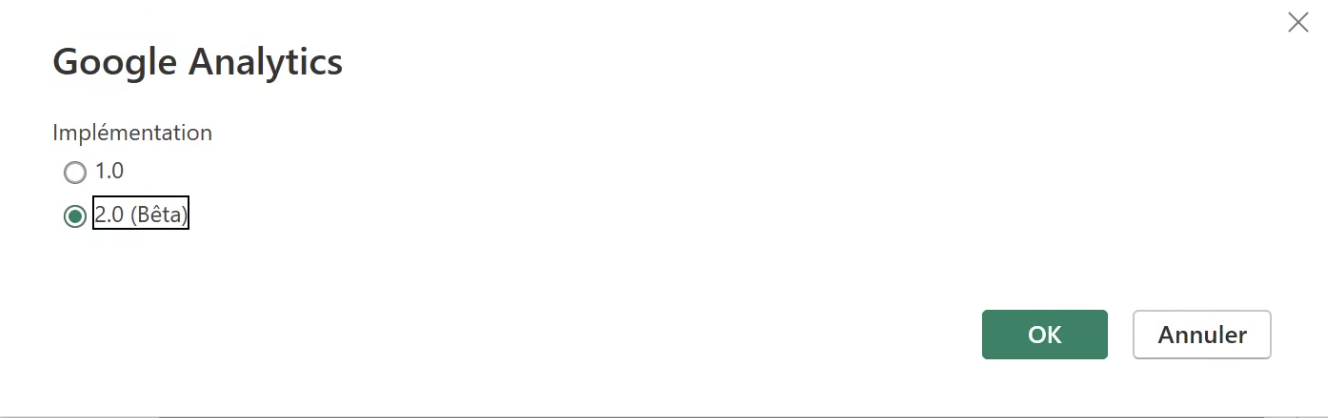
4. Choose 2.0 (Beta) which is for GA4 (1.0 was Universal analytics).
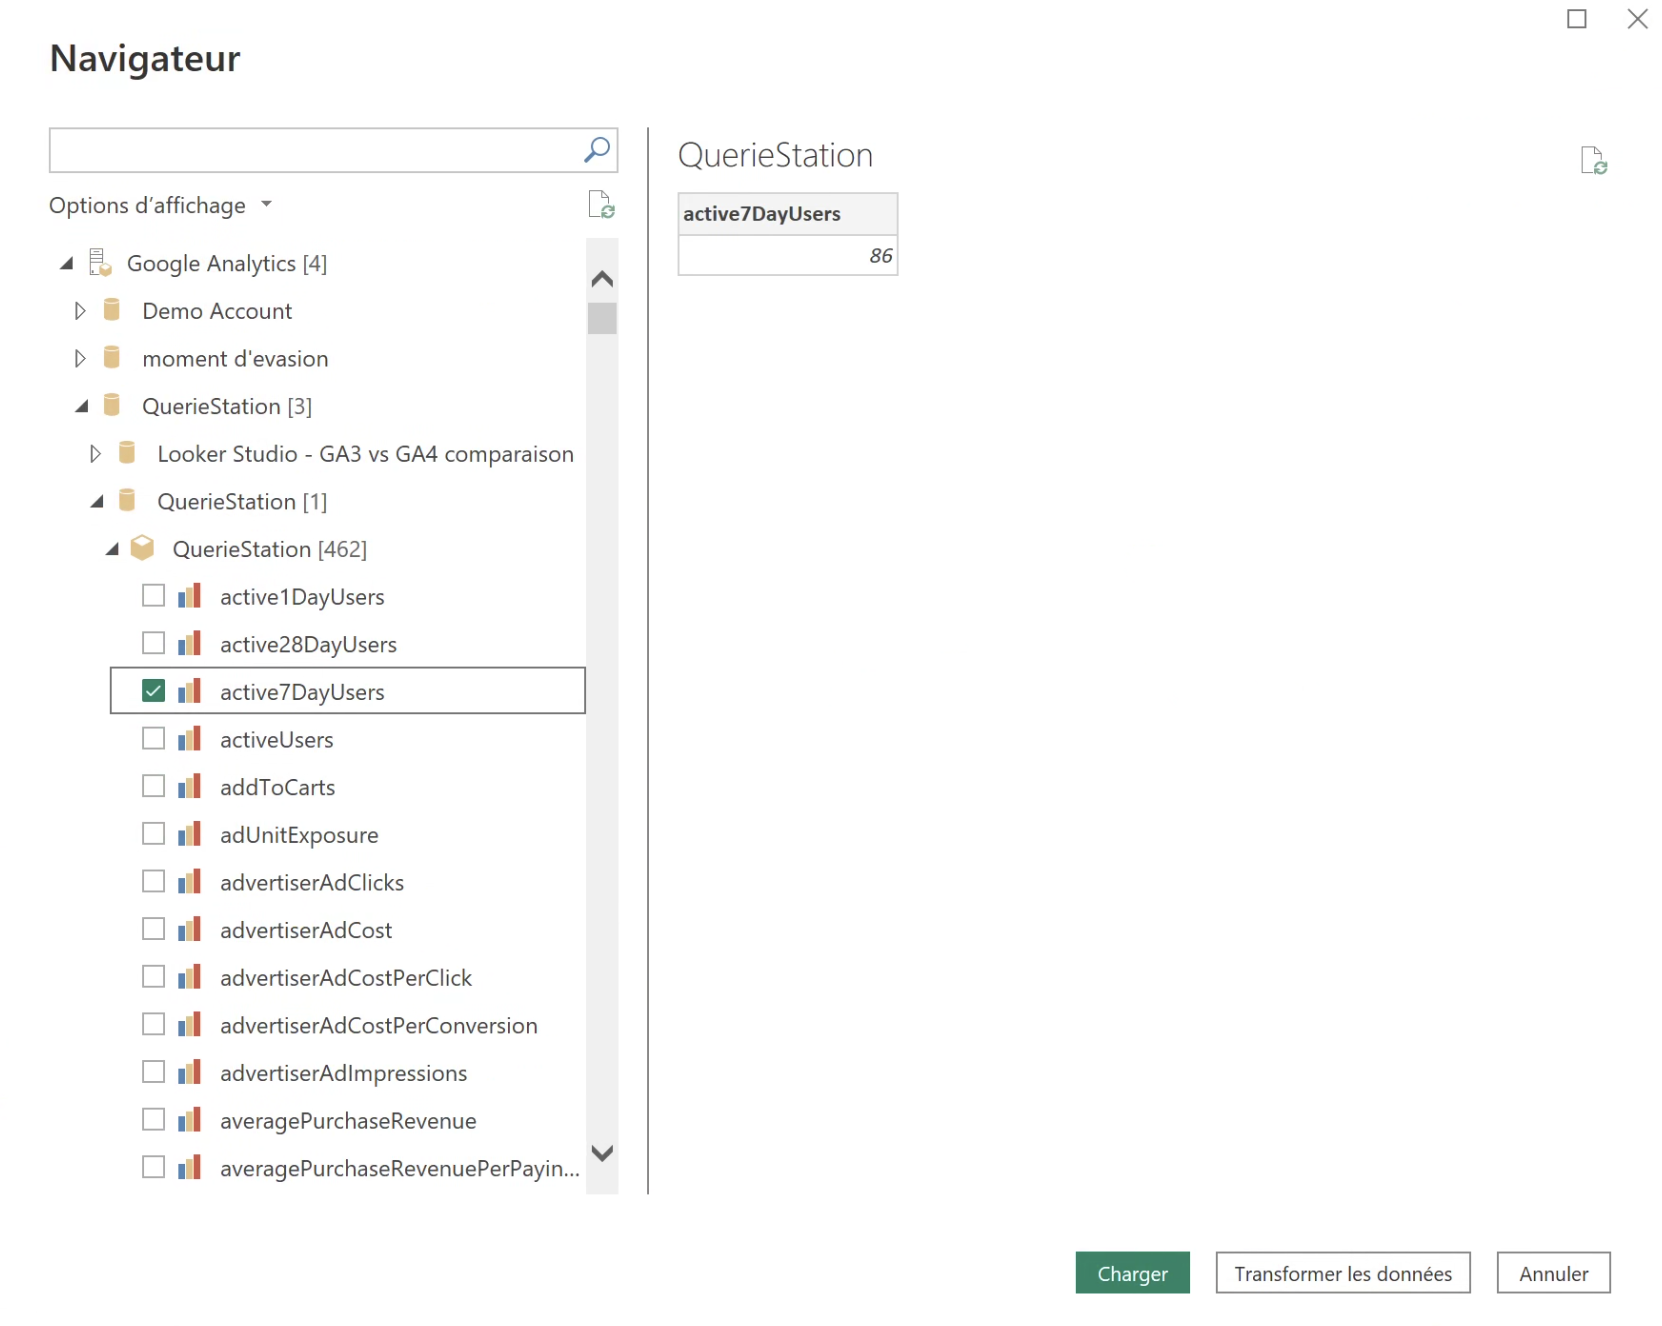
5. You can now access your data and select your fields :
Pros
Easy to connect
Quick update of your data
Almost every metrics and dimensions available
Cons
Limited to 10 dimensions
No customization
Only dimension and metrics that works together according to Google
Google Spreadsheet :
The second way to do it is using Google Spreadsheet. There is an extension that helps you collect the data you need, you can then connect Google sheet to PowerBI easily.
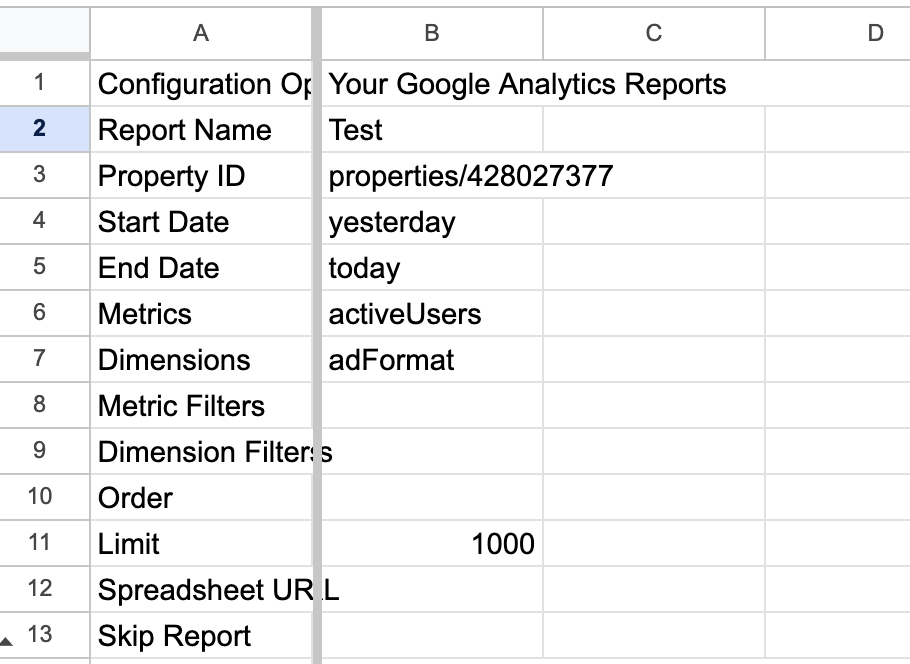
Go to a new Google spreadsheet :
2. Click on Extension and download additional :
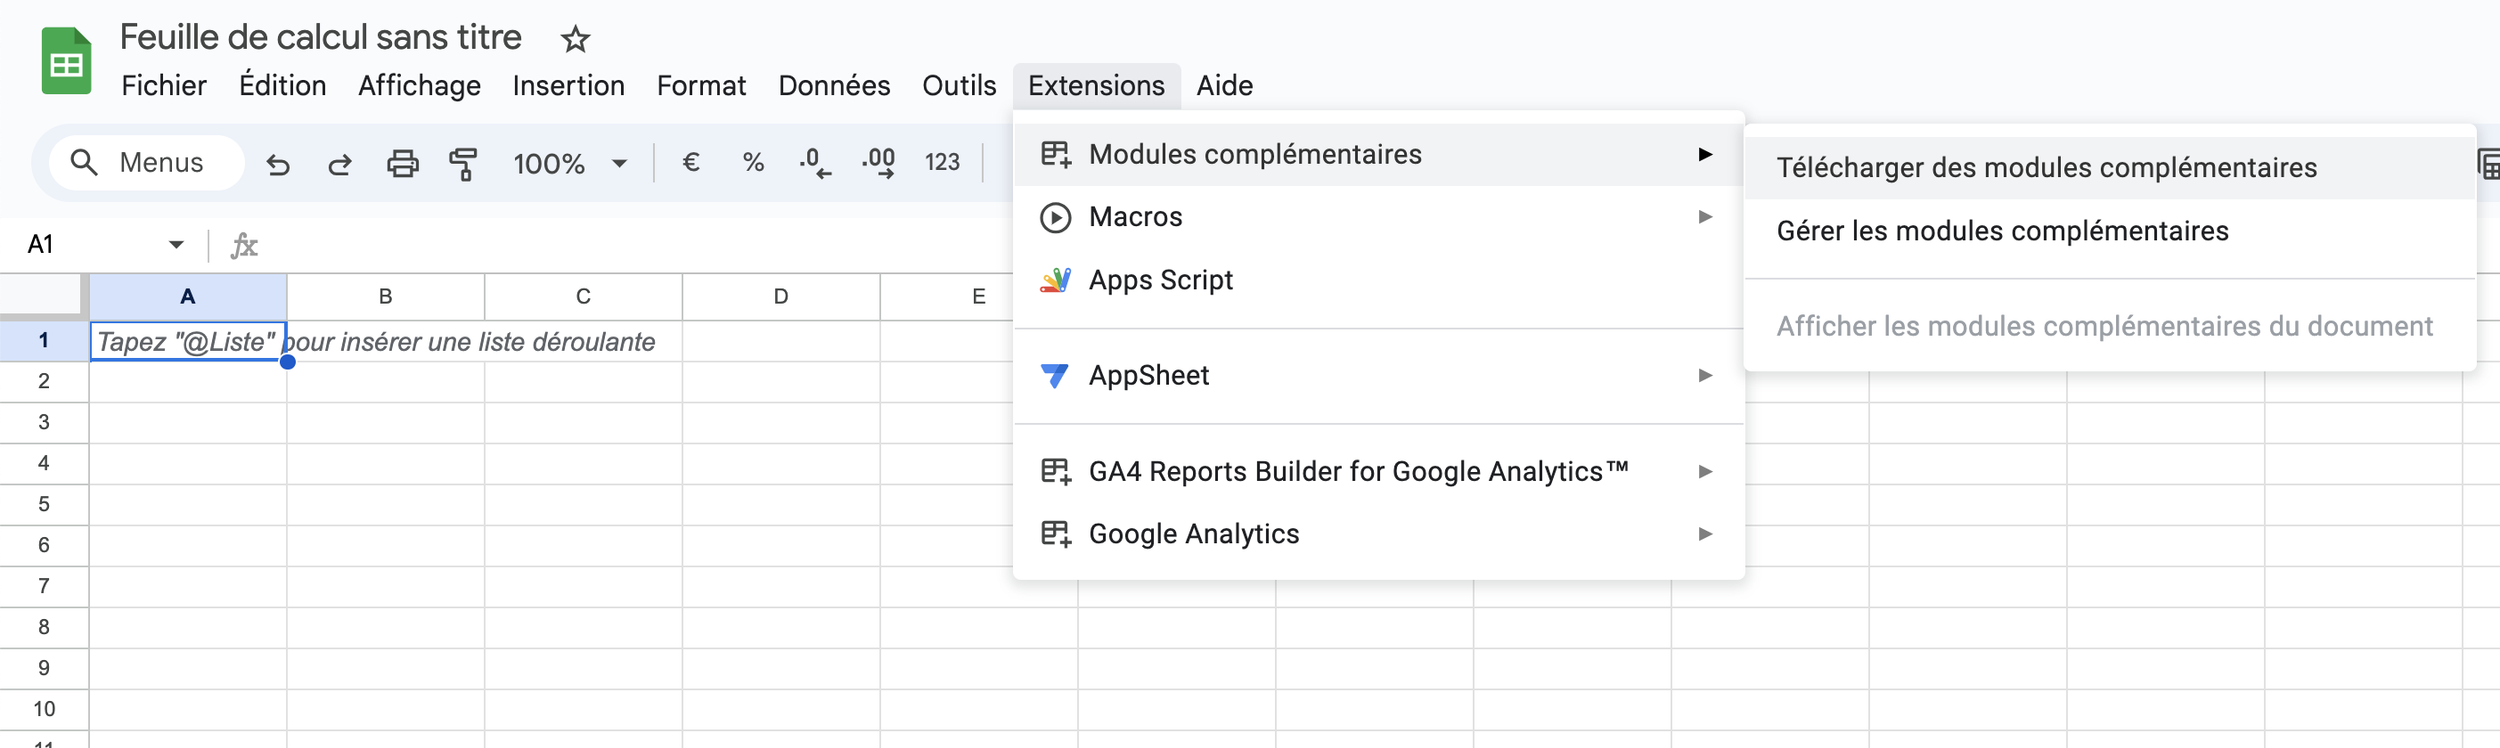
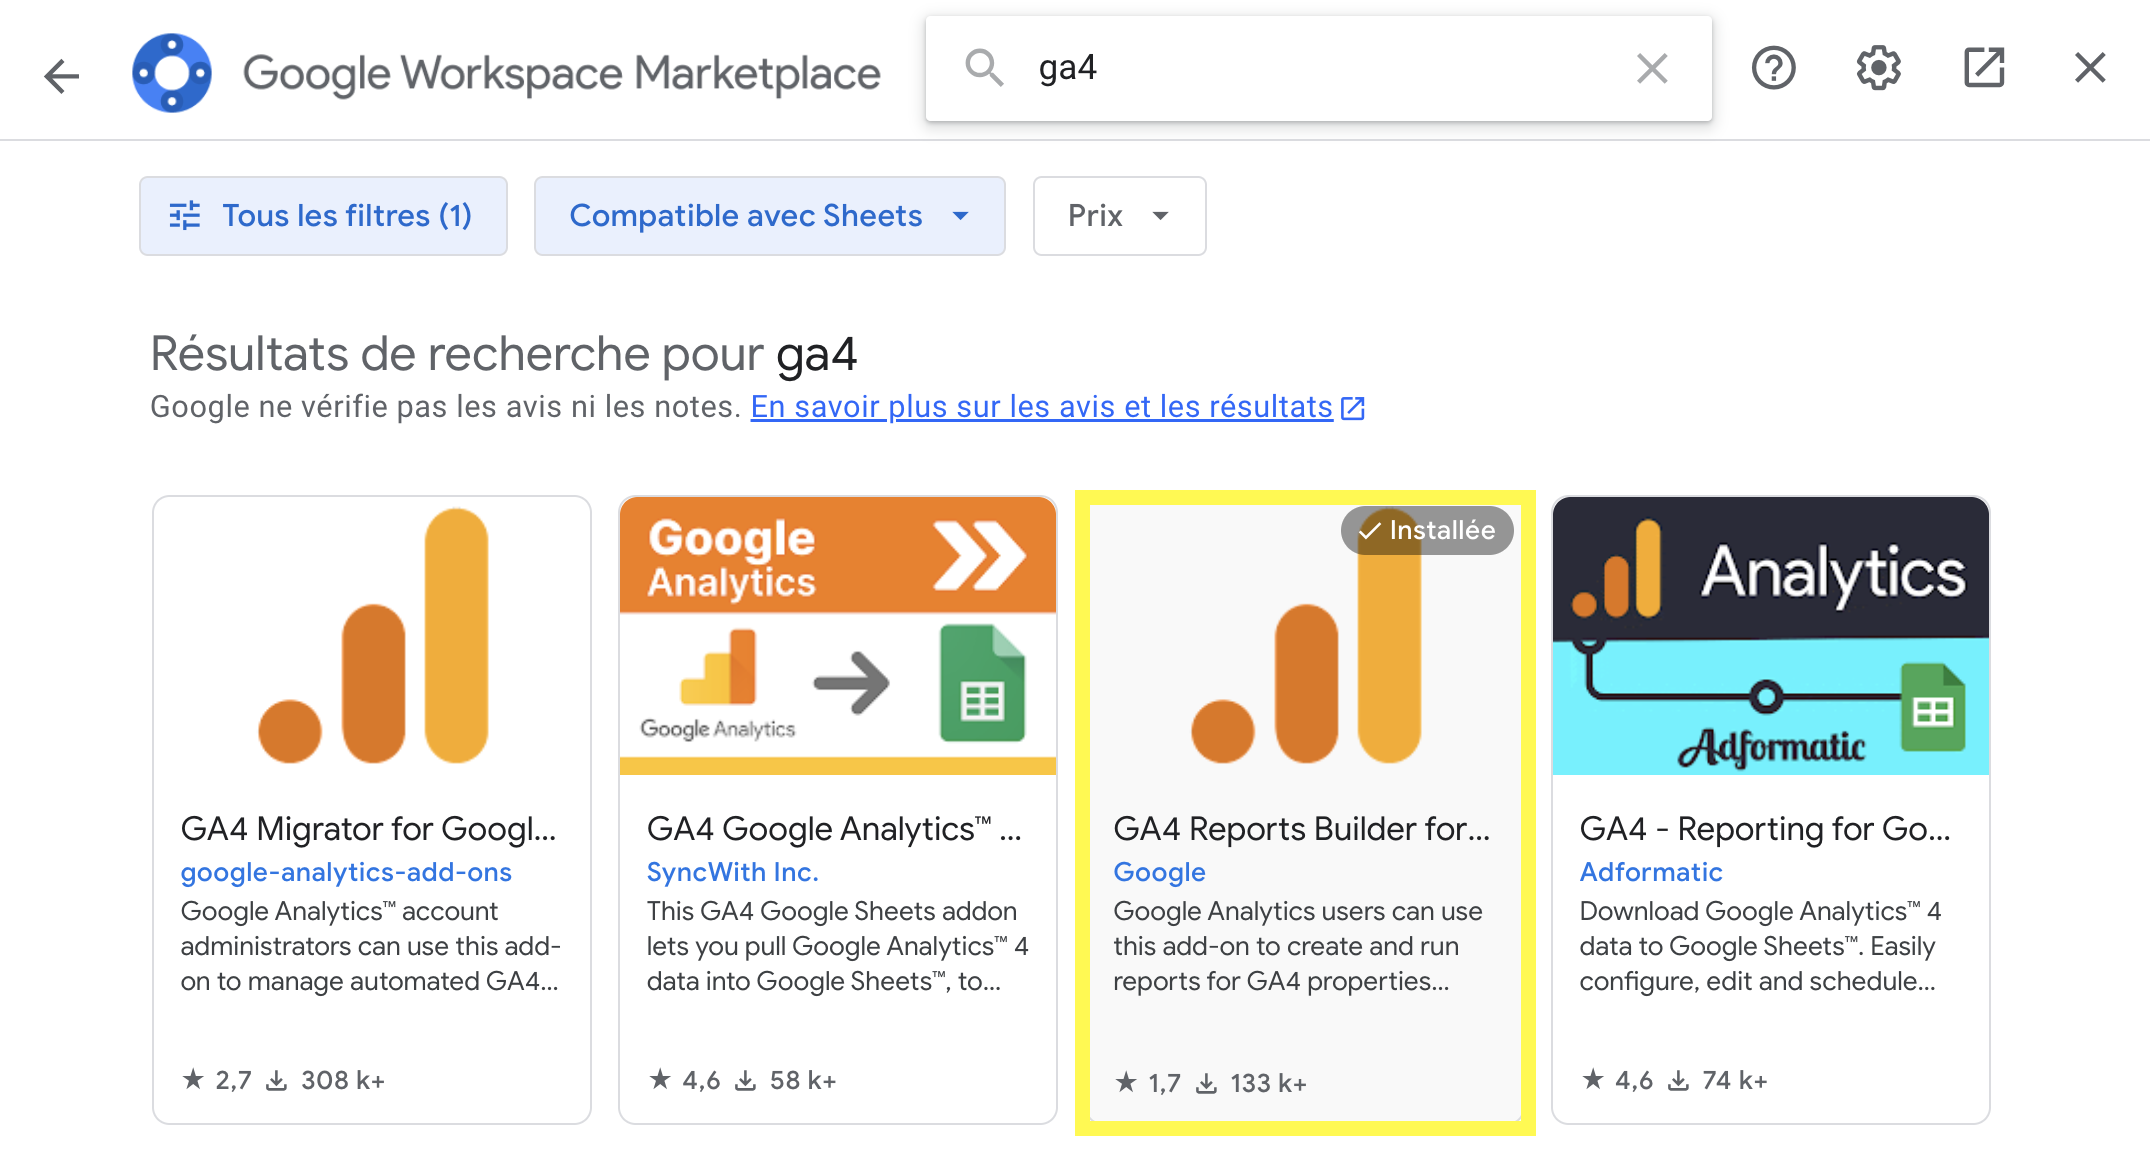
3. Type ga4 in the search bar and install “GA4 Reports Builder for Google Analytics”.
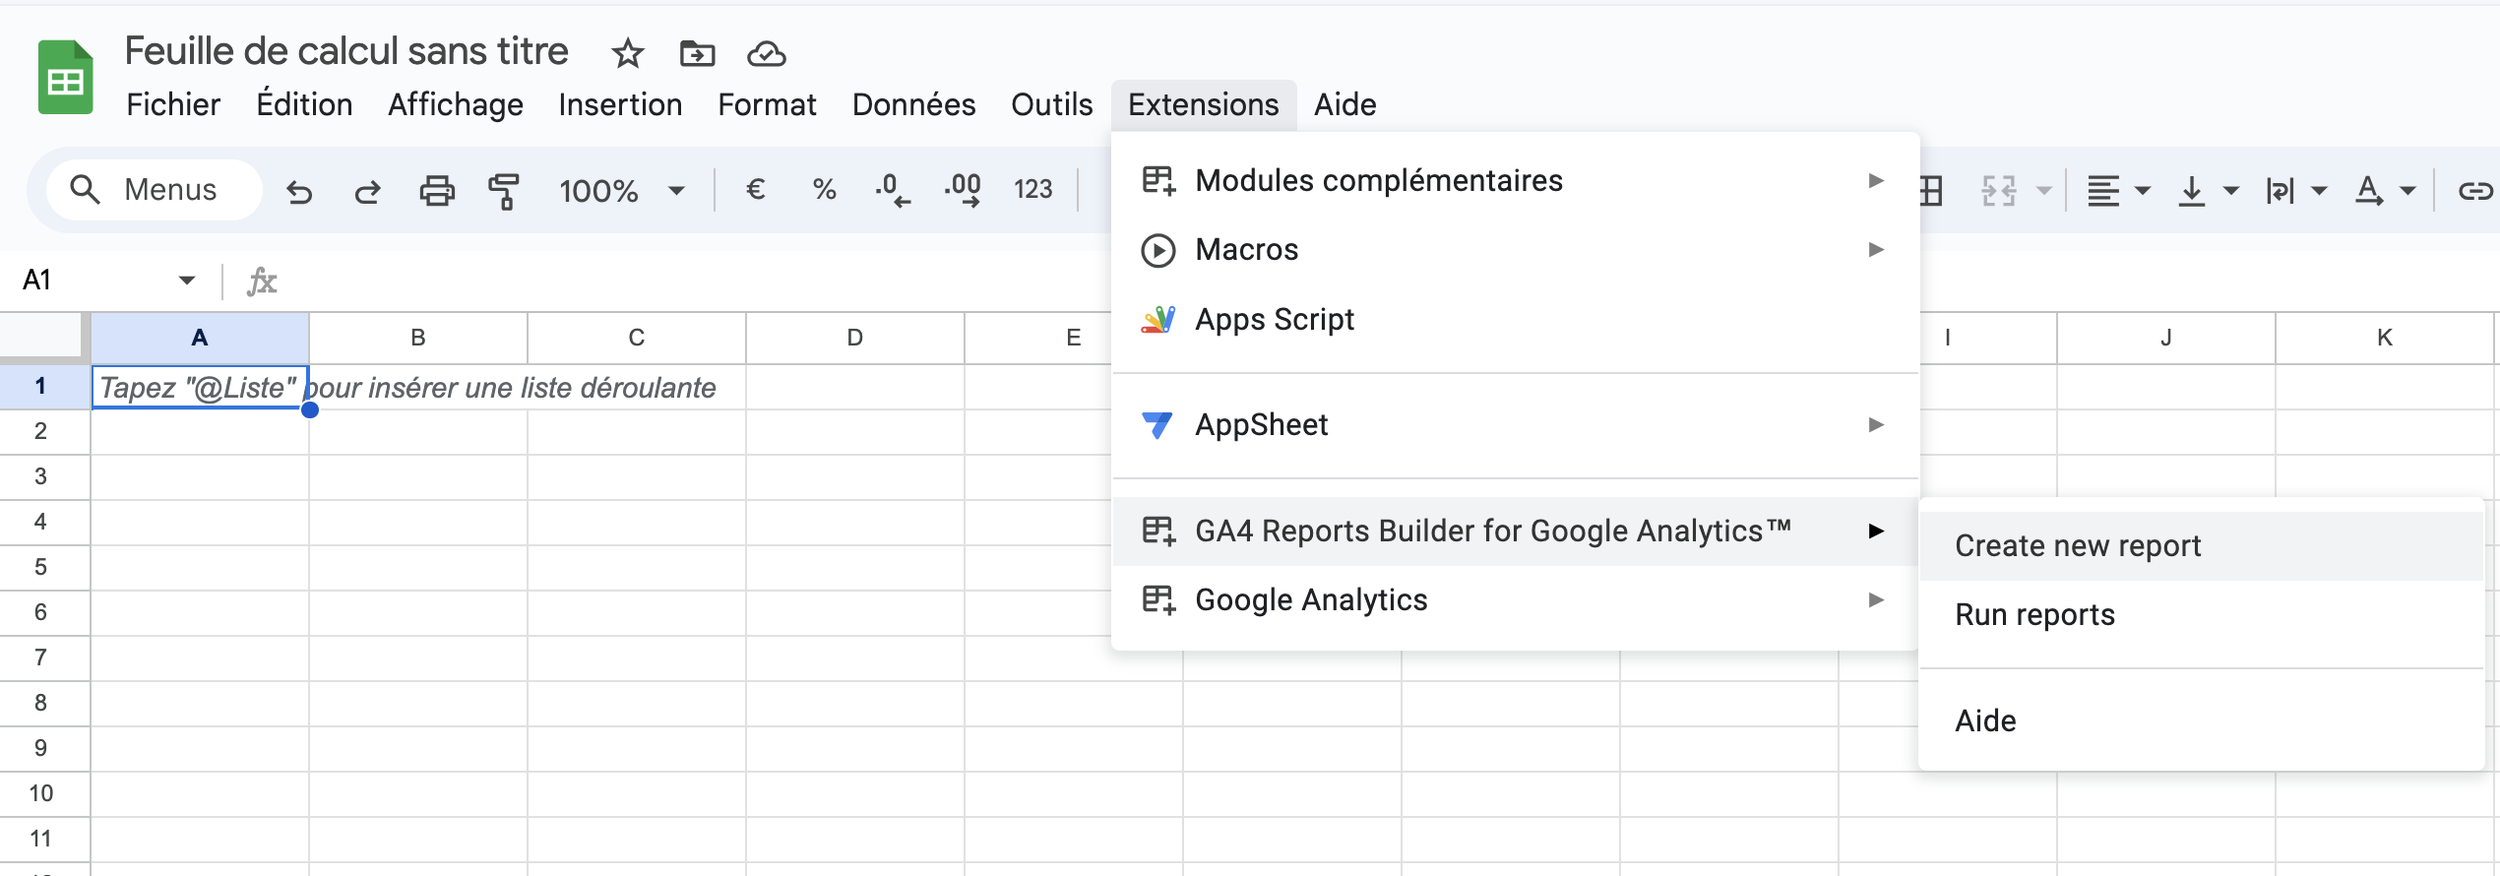
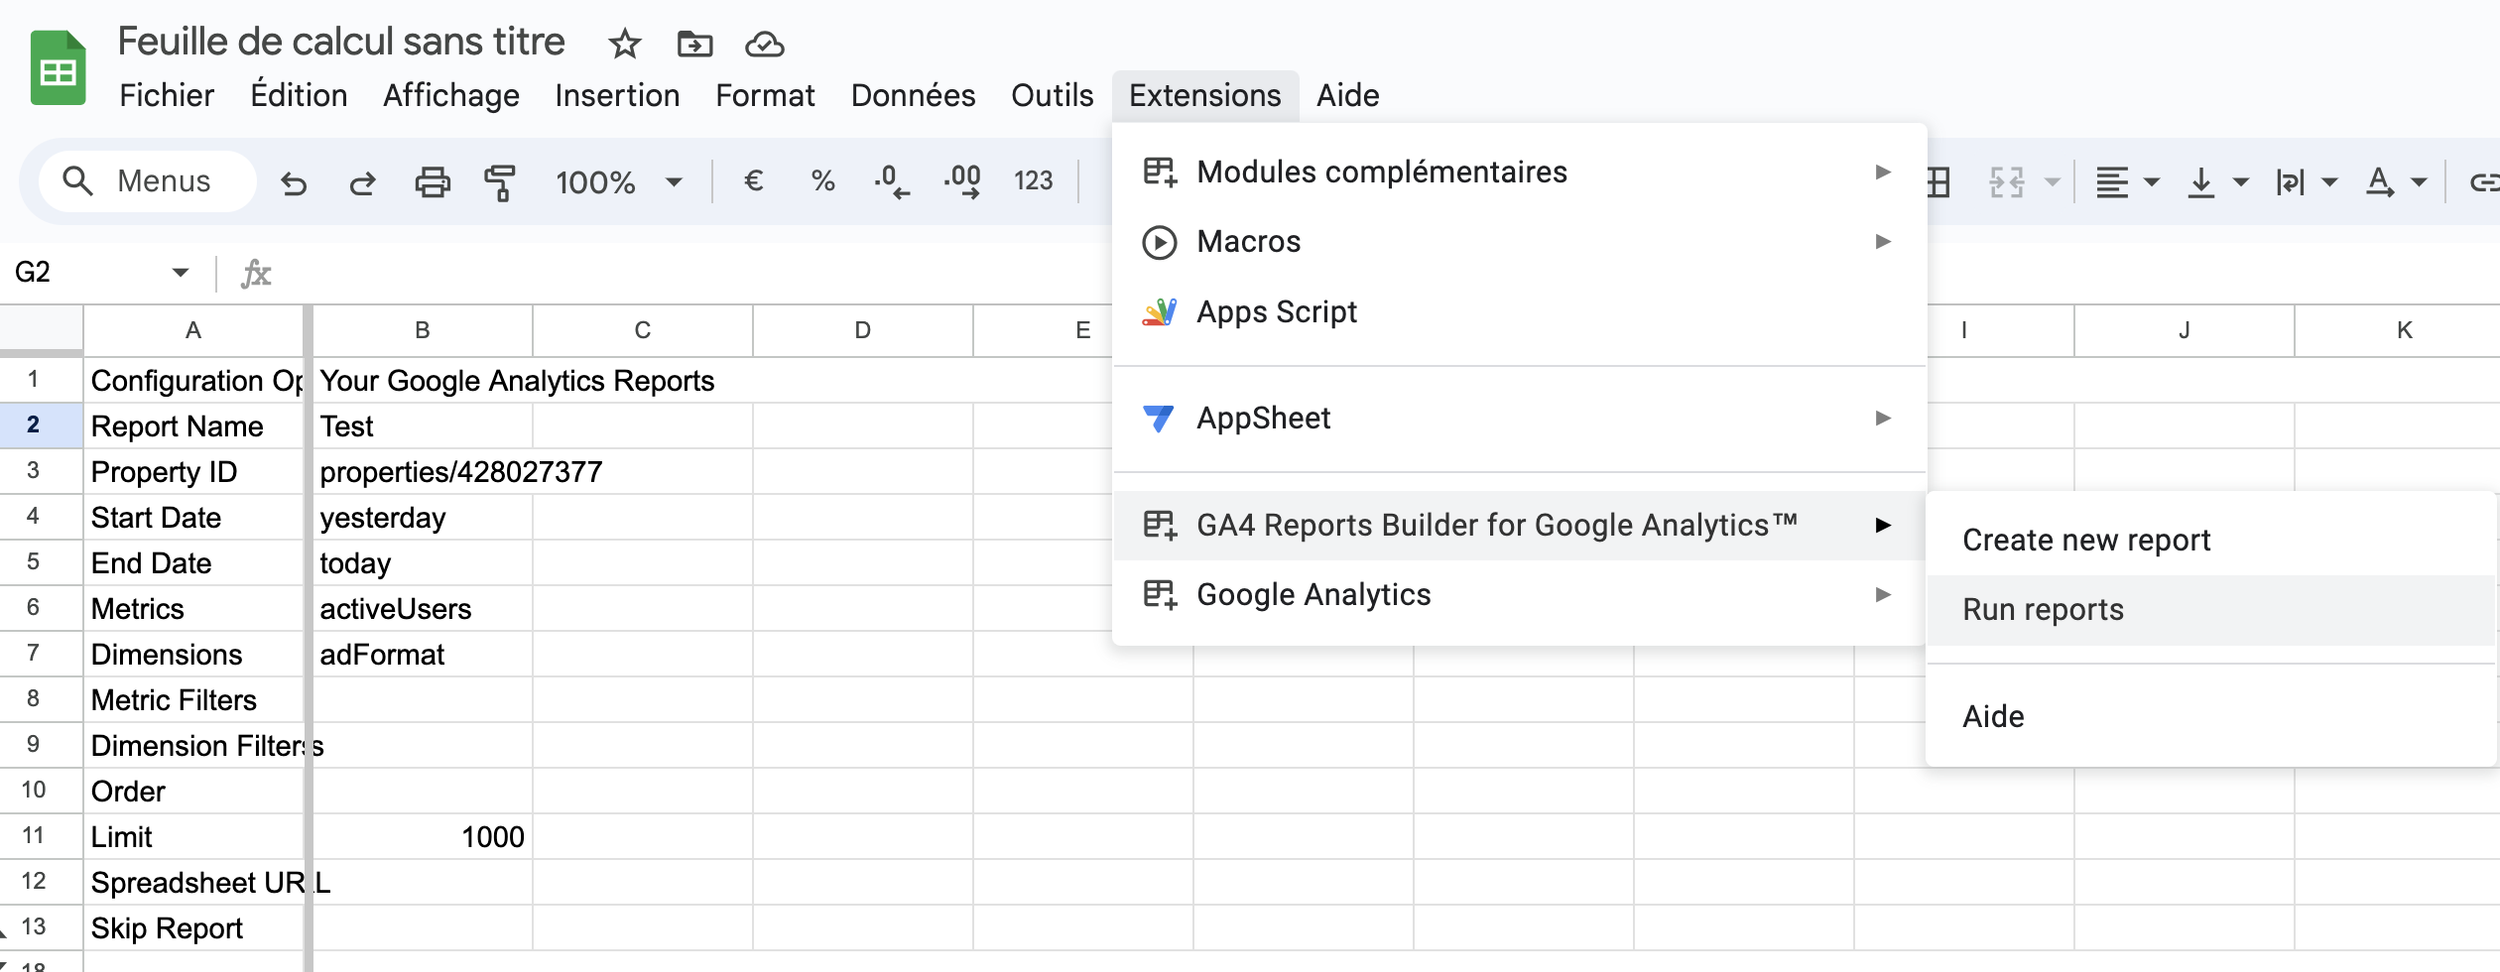
4. Now, you can go to extensions, select the one you just installed and click “Create new report”
5. Select your account, property, dimensions and metrics
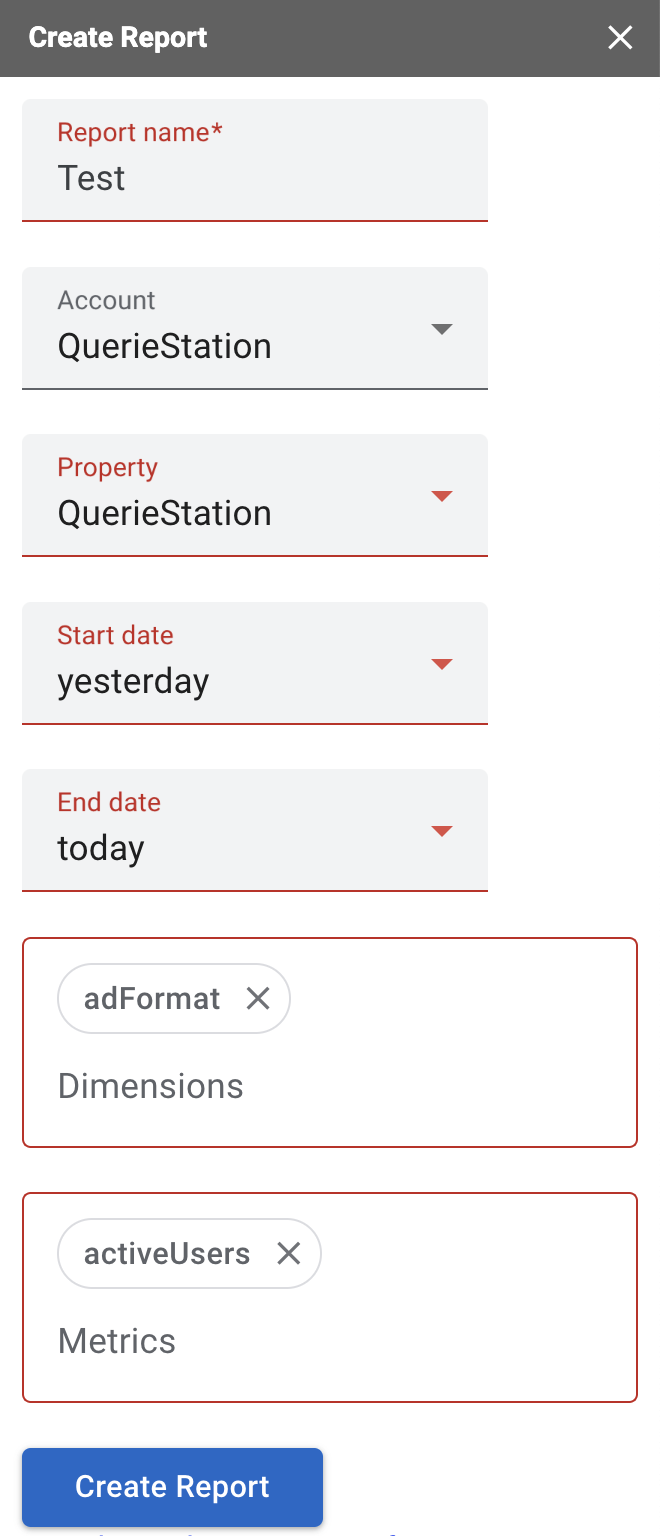
6. Click on Create Report and it will create a configuration sheet with all your informations that you can directly change in the sheet.
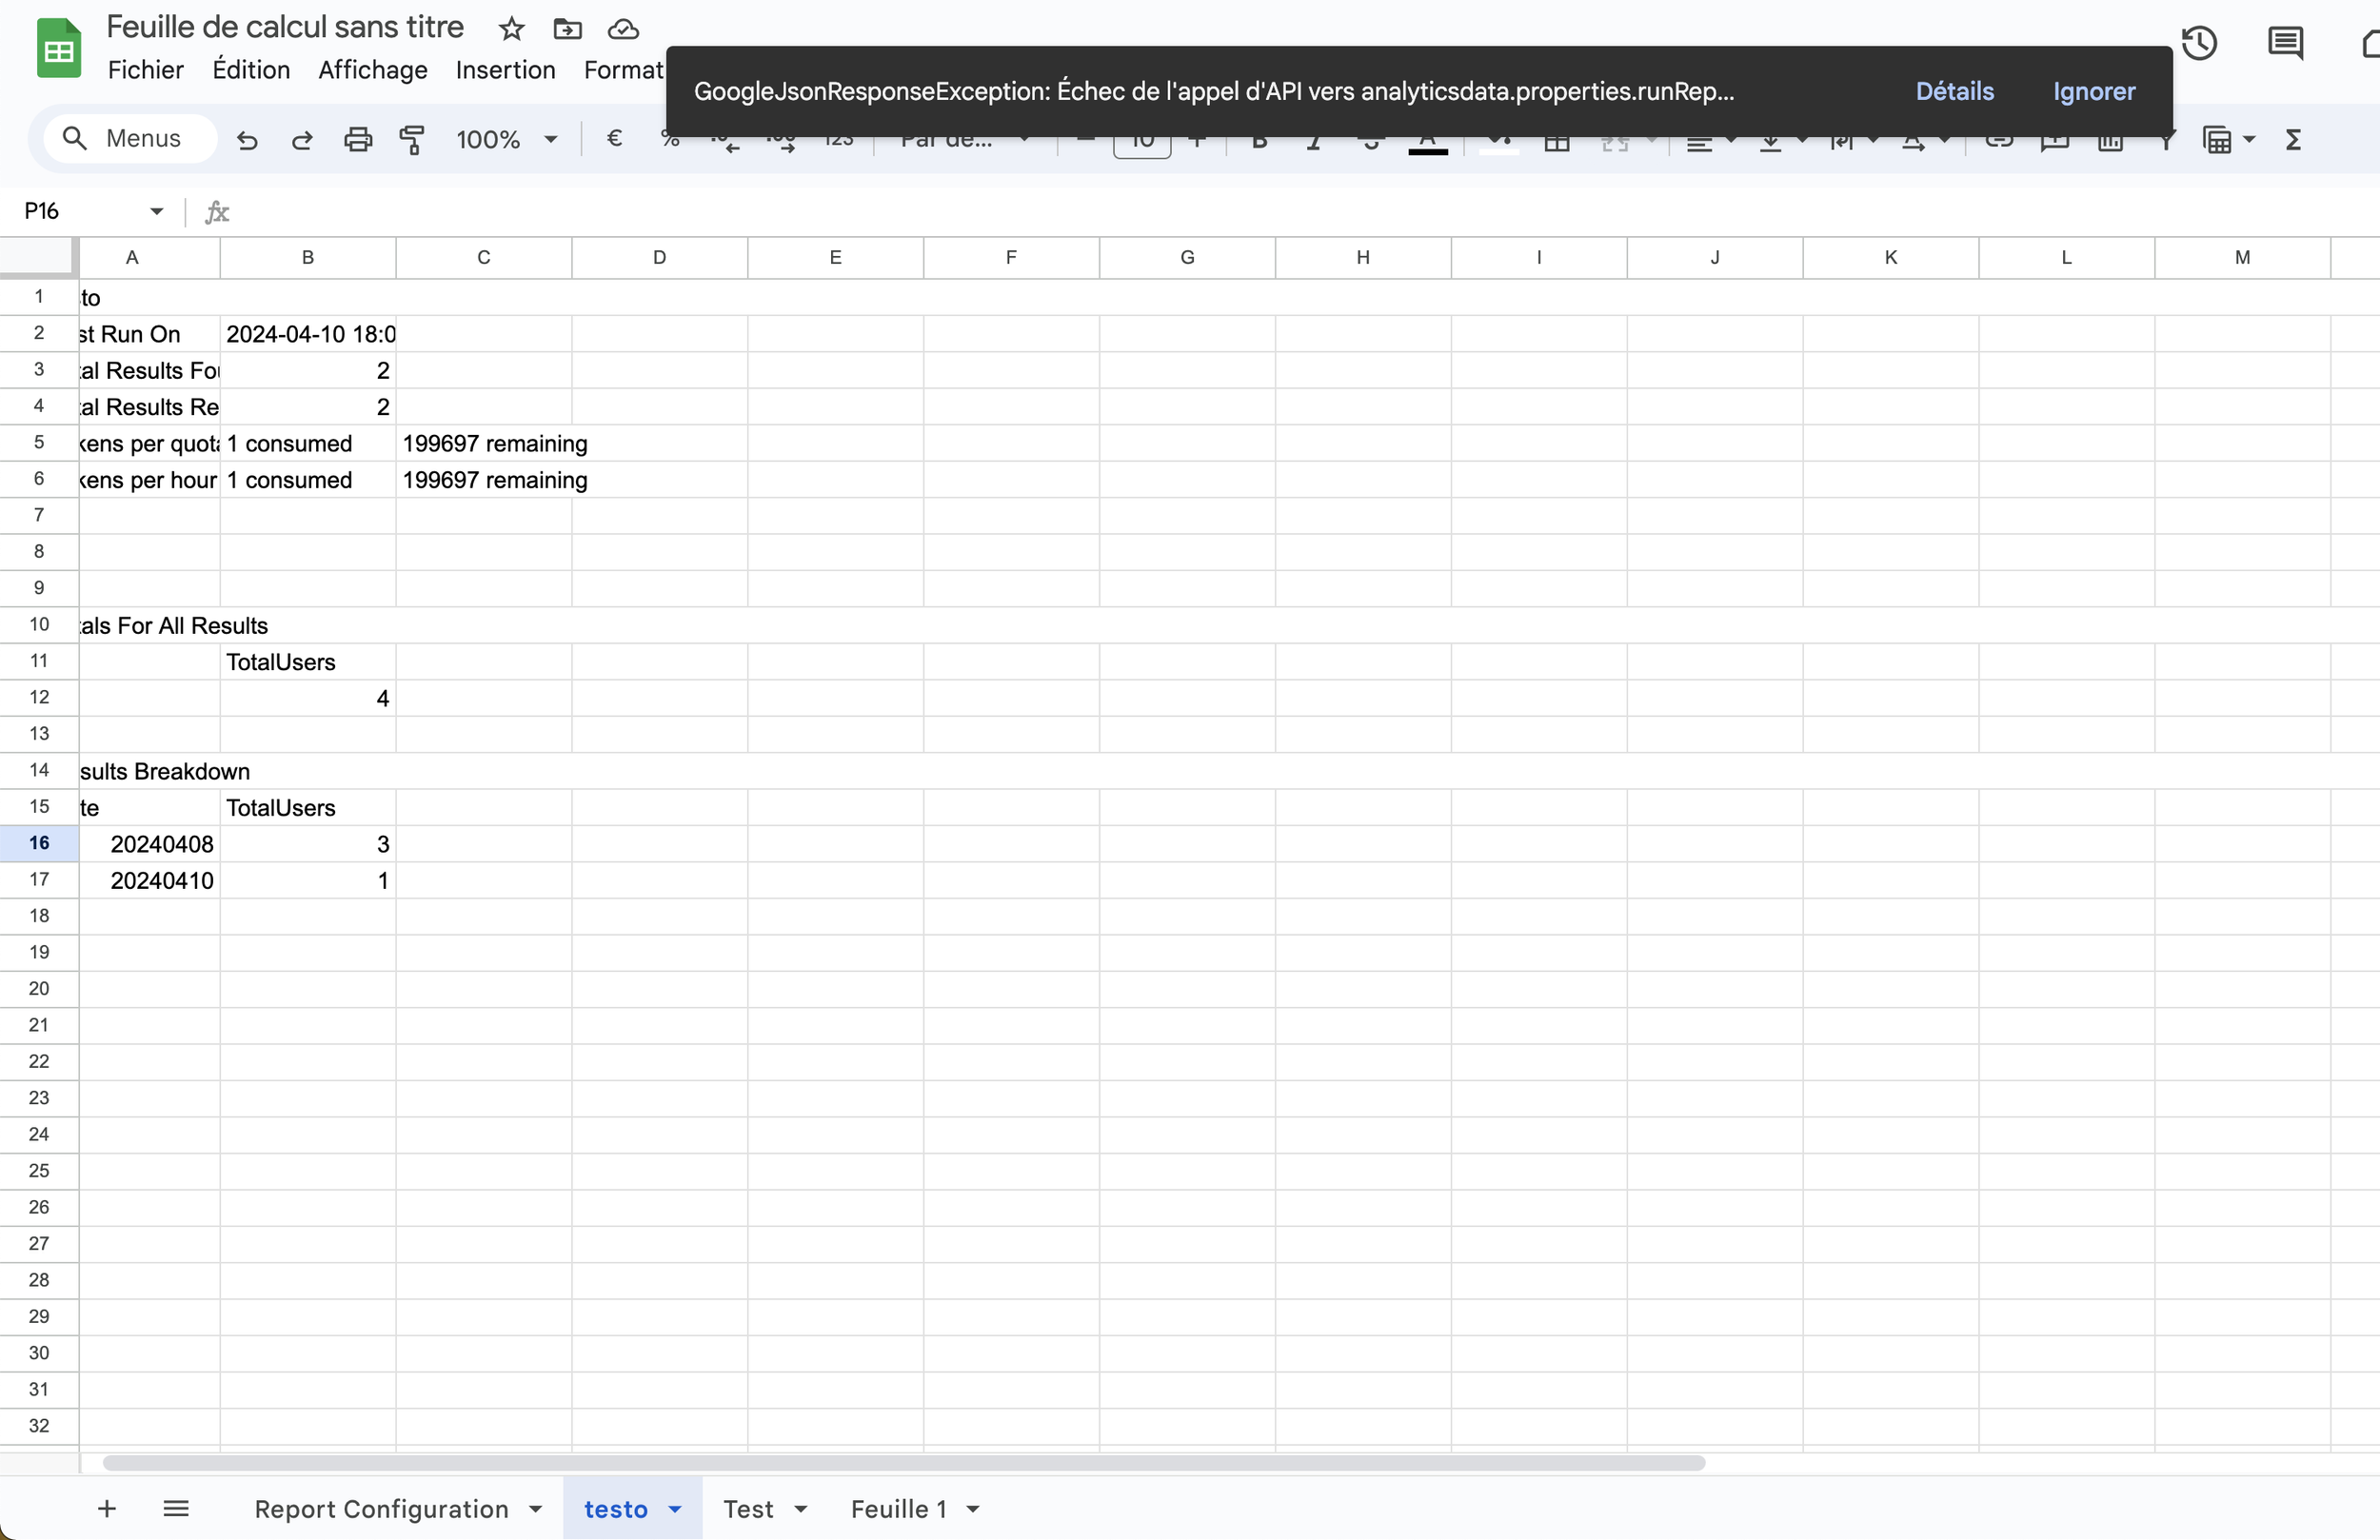
7. You can now run your report.
8. This will create a new tab in the same sheet with all your clean data.
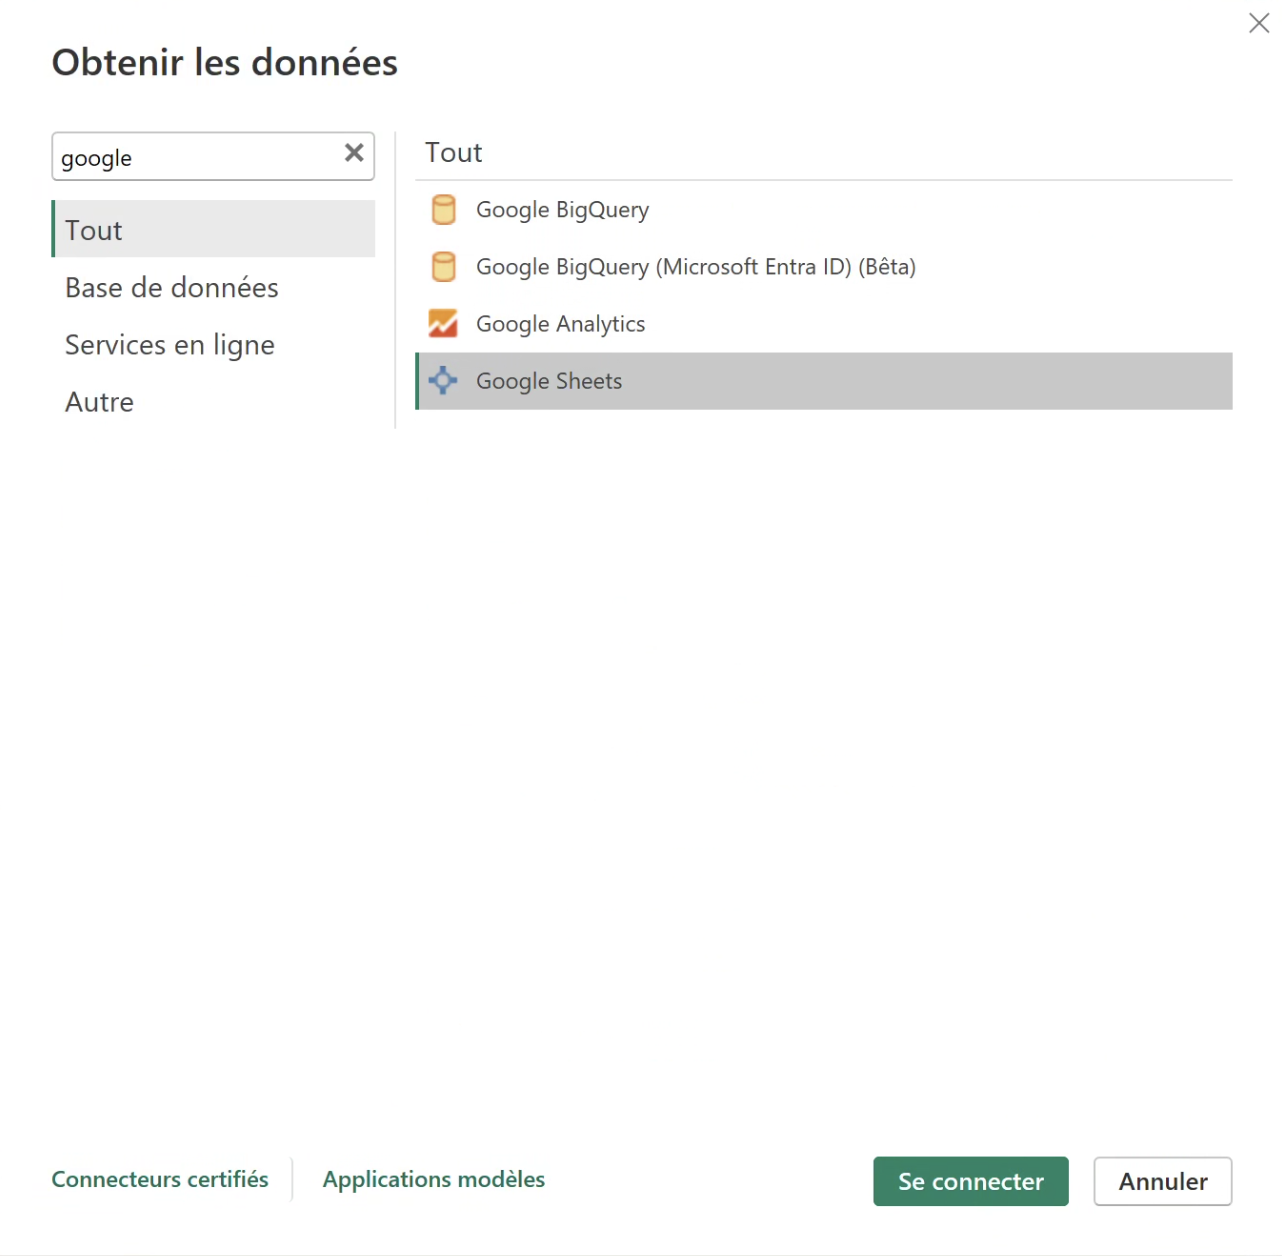
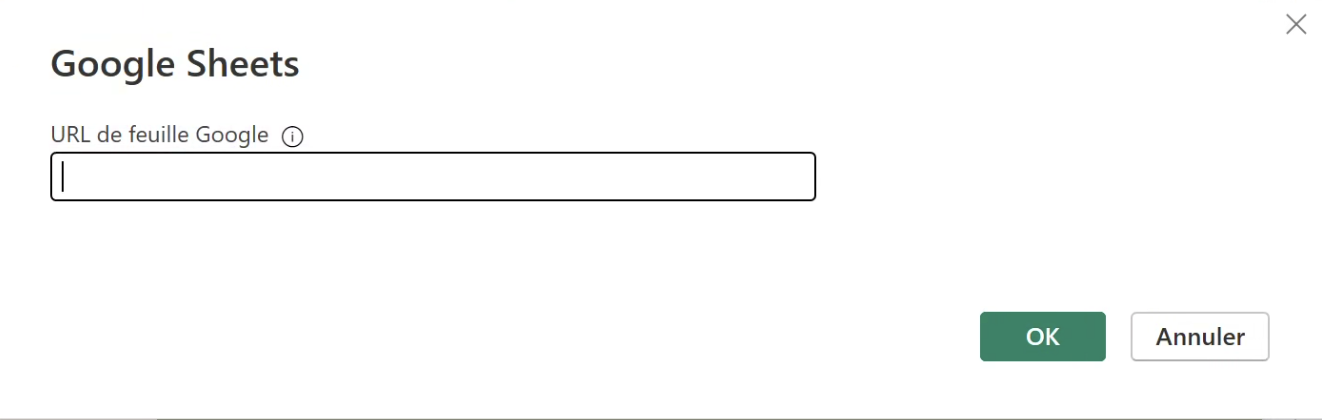
9. You then launch powerBI, click on Add data and type “Google Sheet” in the search bar.
10. Put your Google sheet URL and then click on the right tab and “transform” you data.
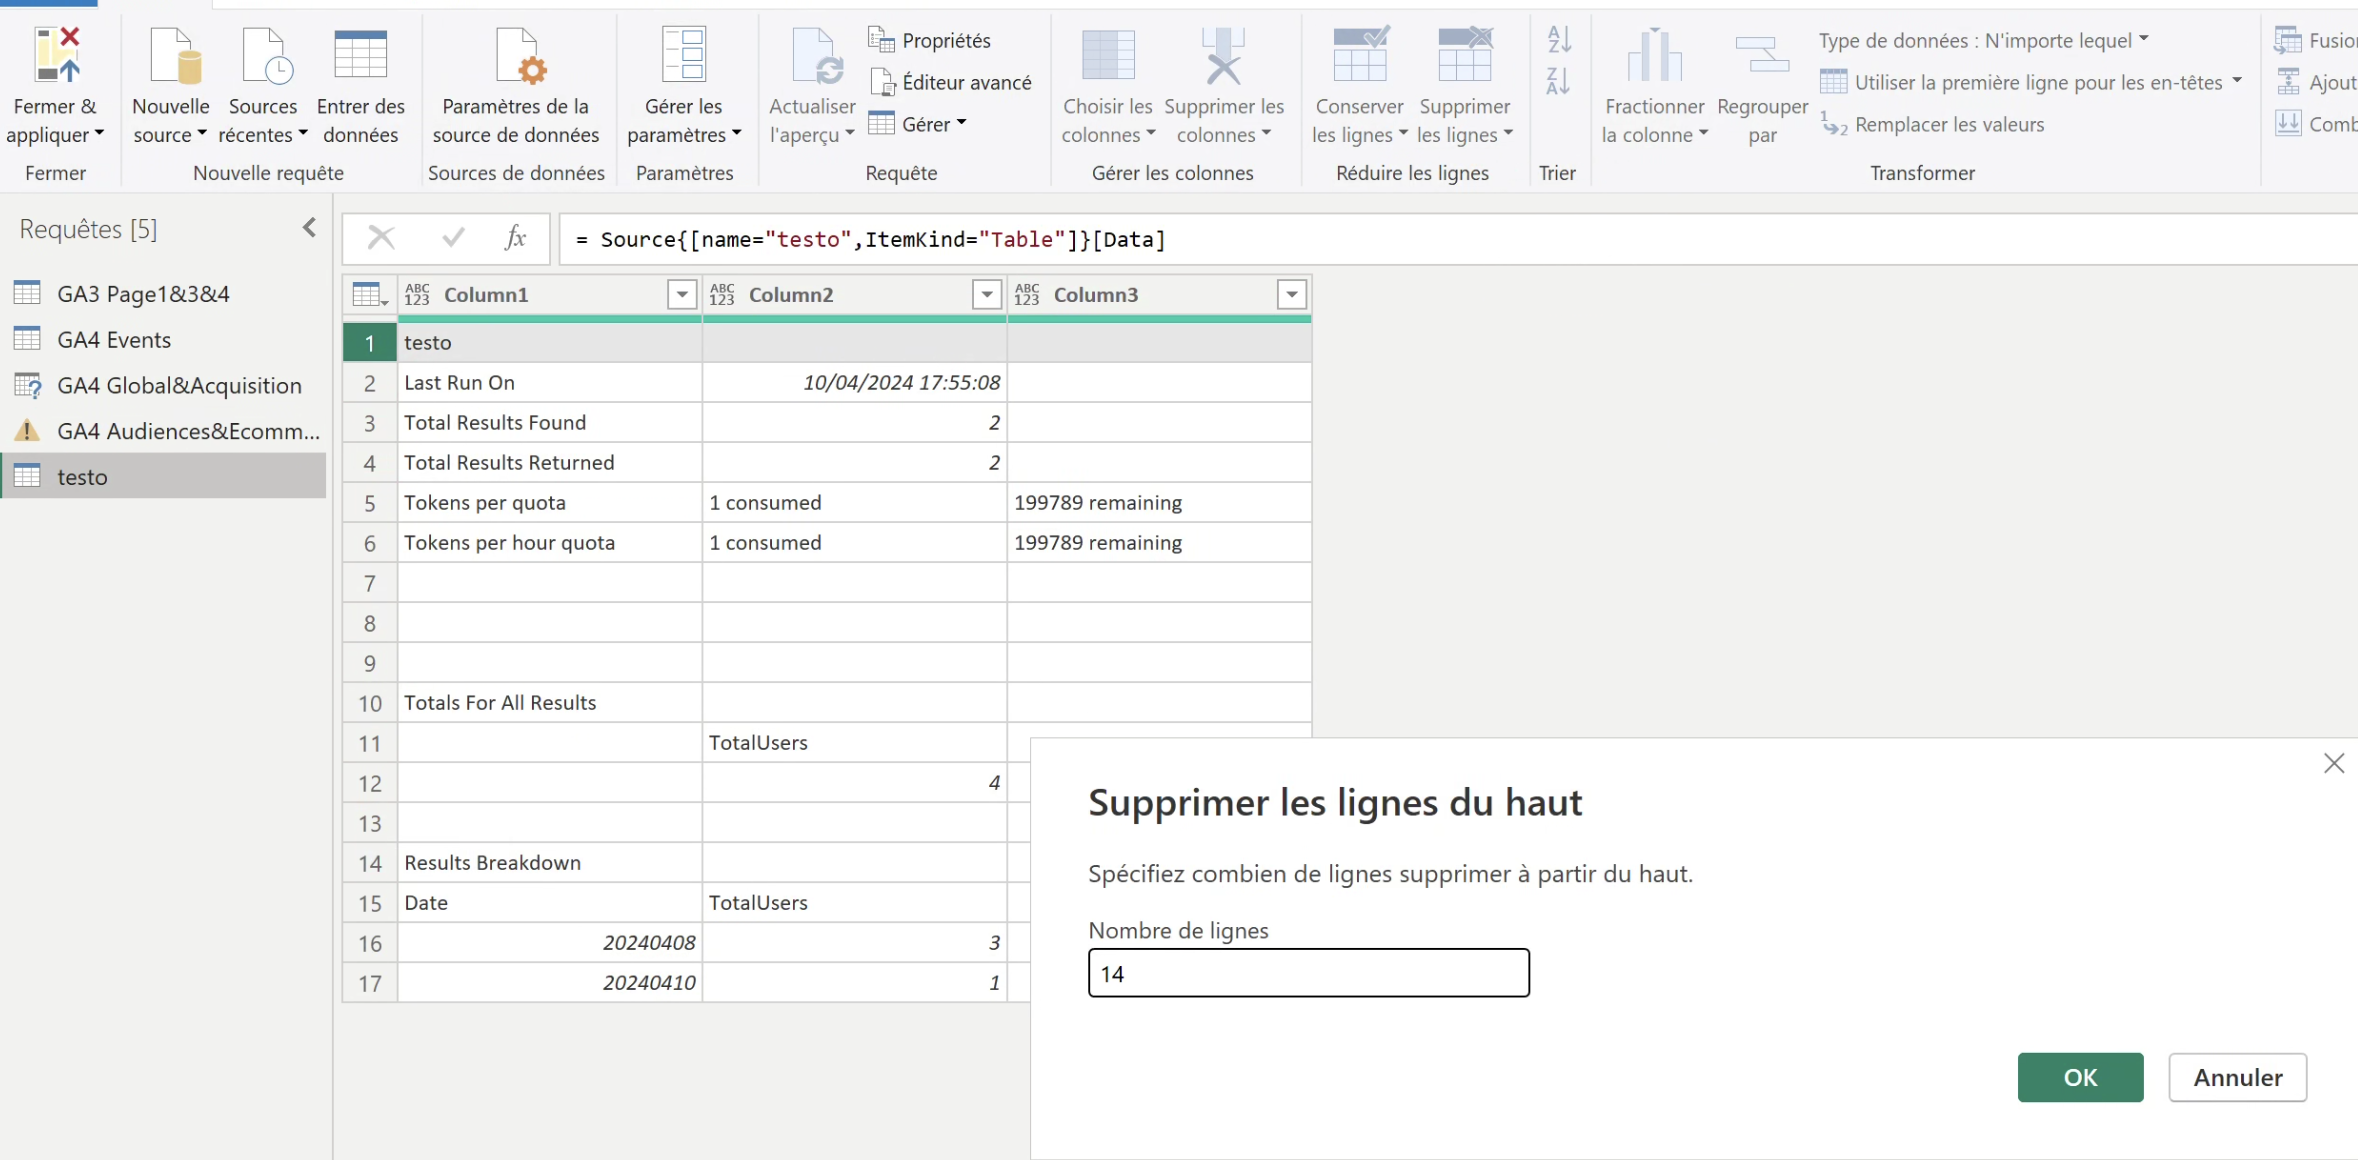
11. Click on delete upper rows
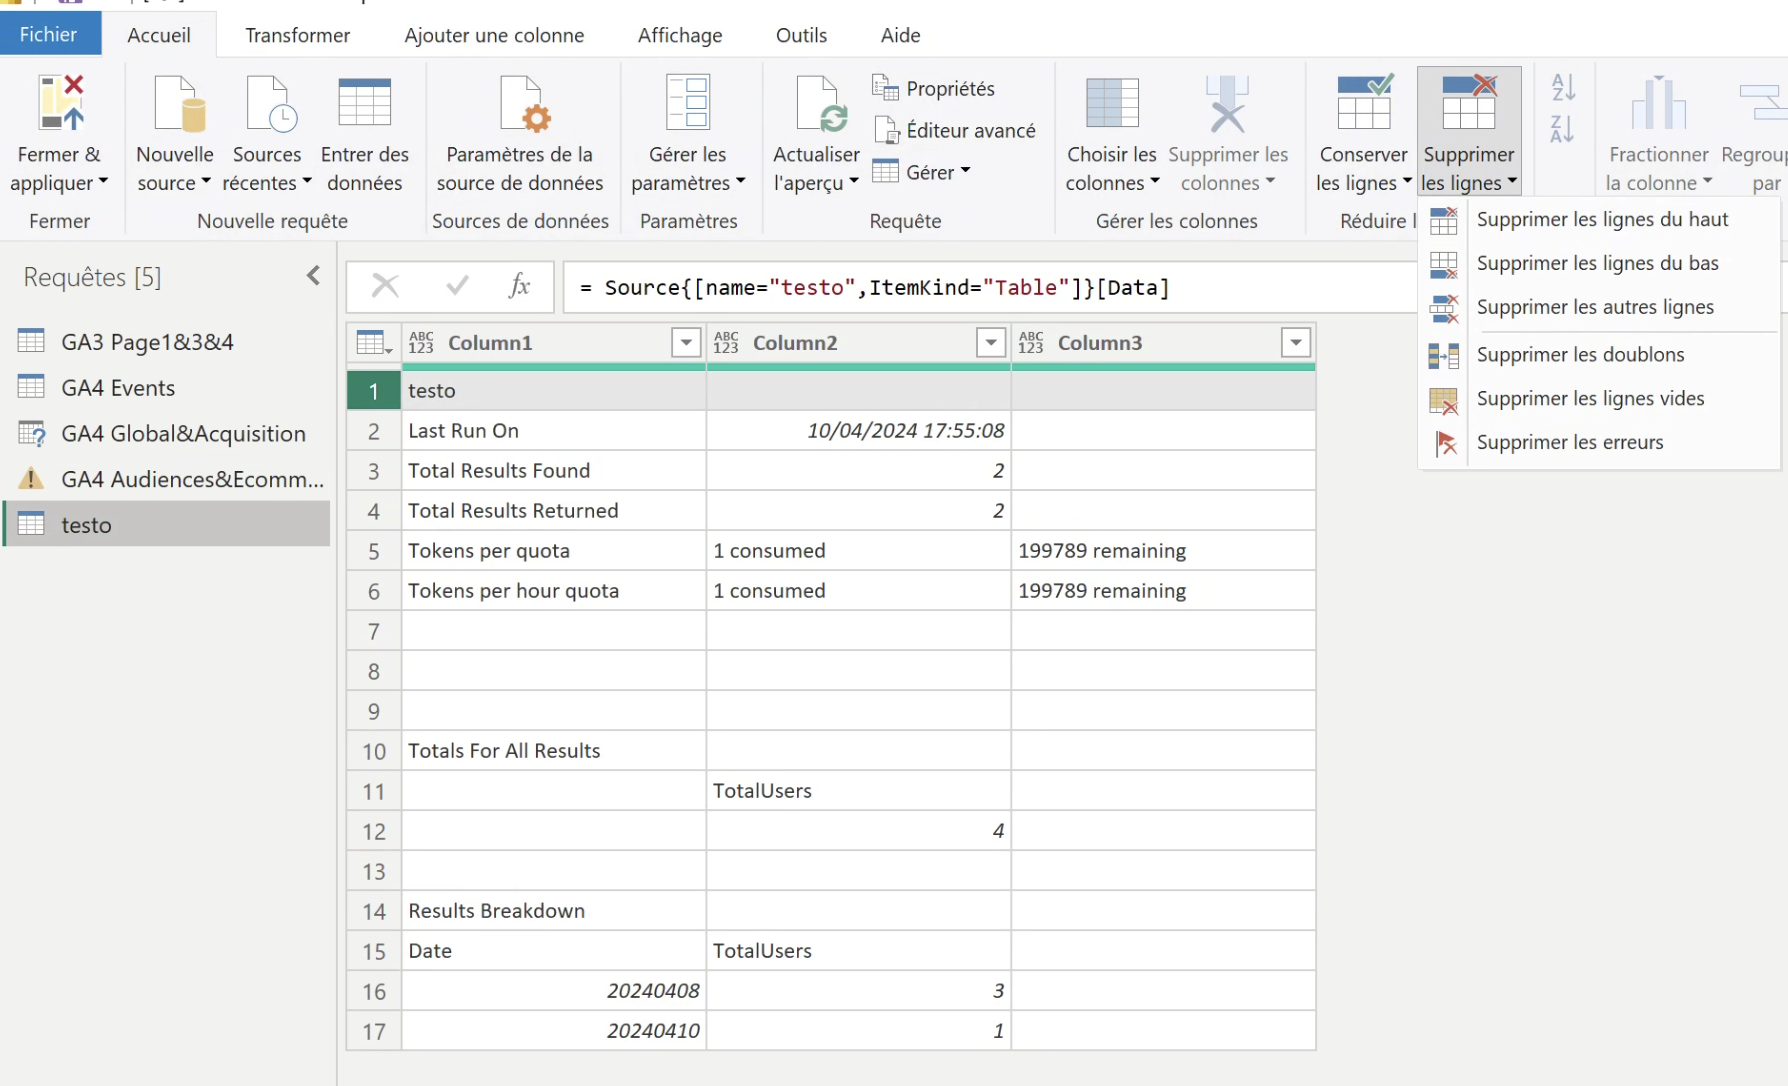
12. Select the number of rows to delete, here 14 :
You now have access to your clean data !
Pros
More customizable data
Create more reports quickly to add more data
Cons
Also limited to 10 dimensions
Need manual refresh
Quite long to implement
Google Bigquery :
Out of the 3 options, Here is my favorite and recommended one :
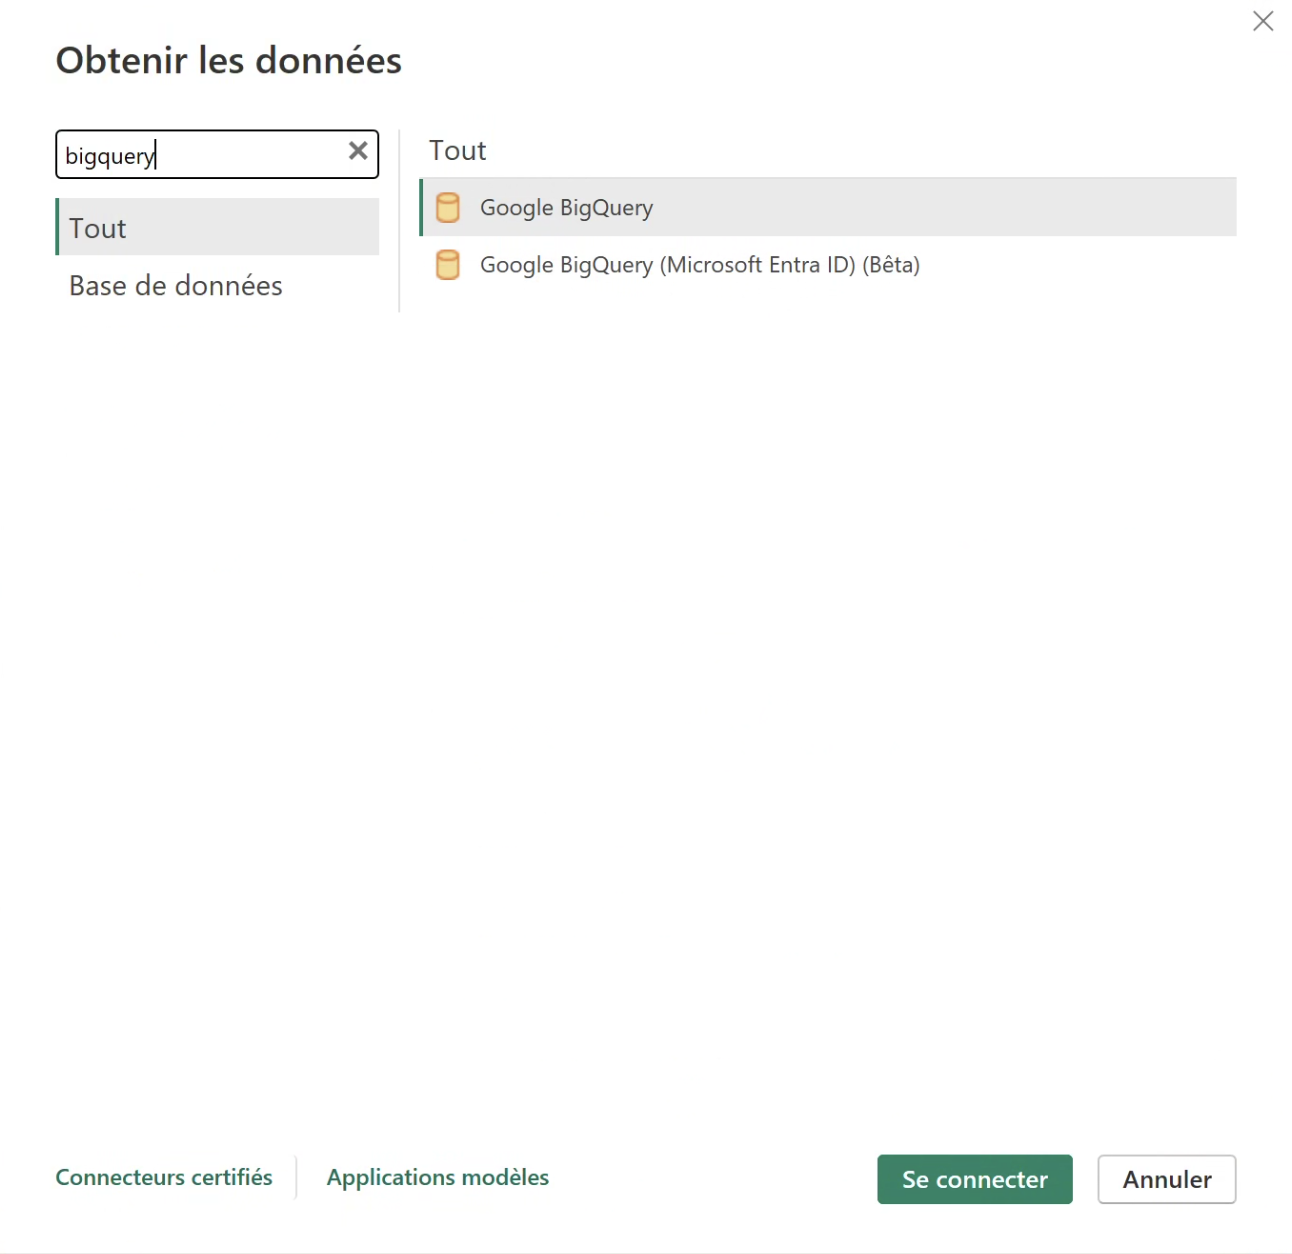
1. Open your PowerBI desktop app, go to your report and click on “add data”
2. Type “BigQuery” into the search bar and select Google BigQuery
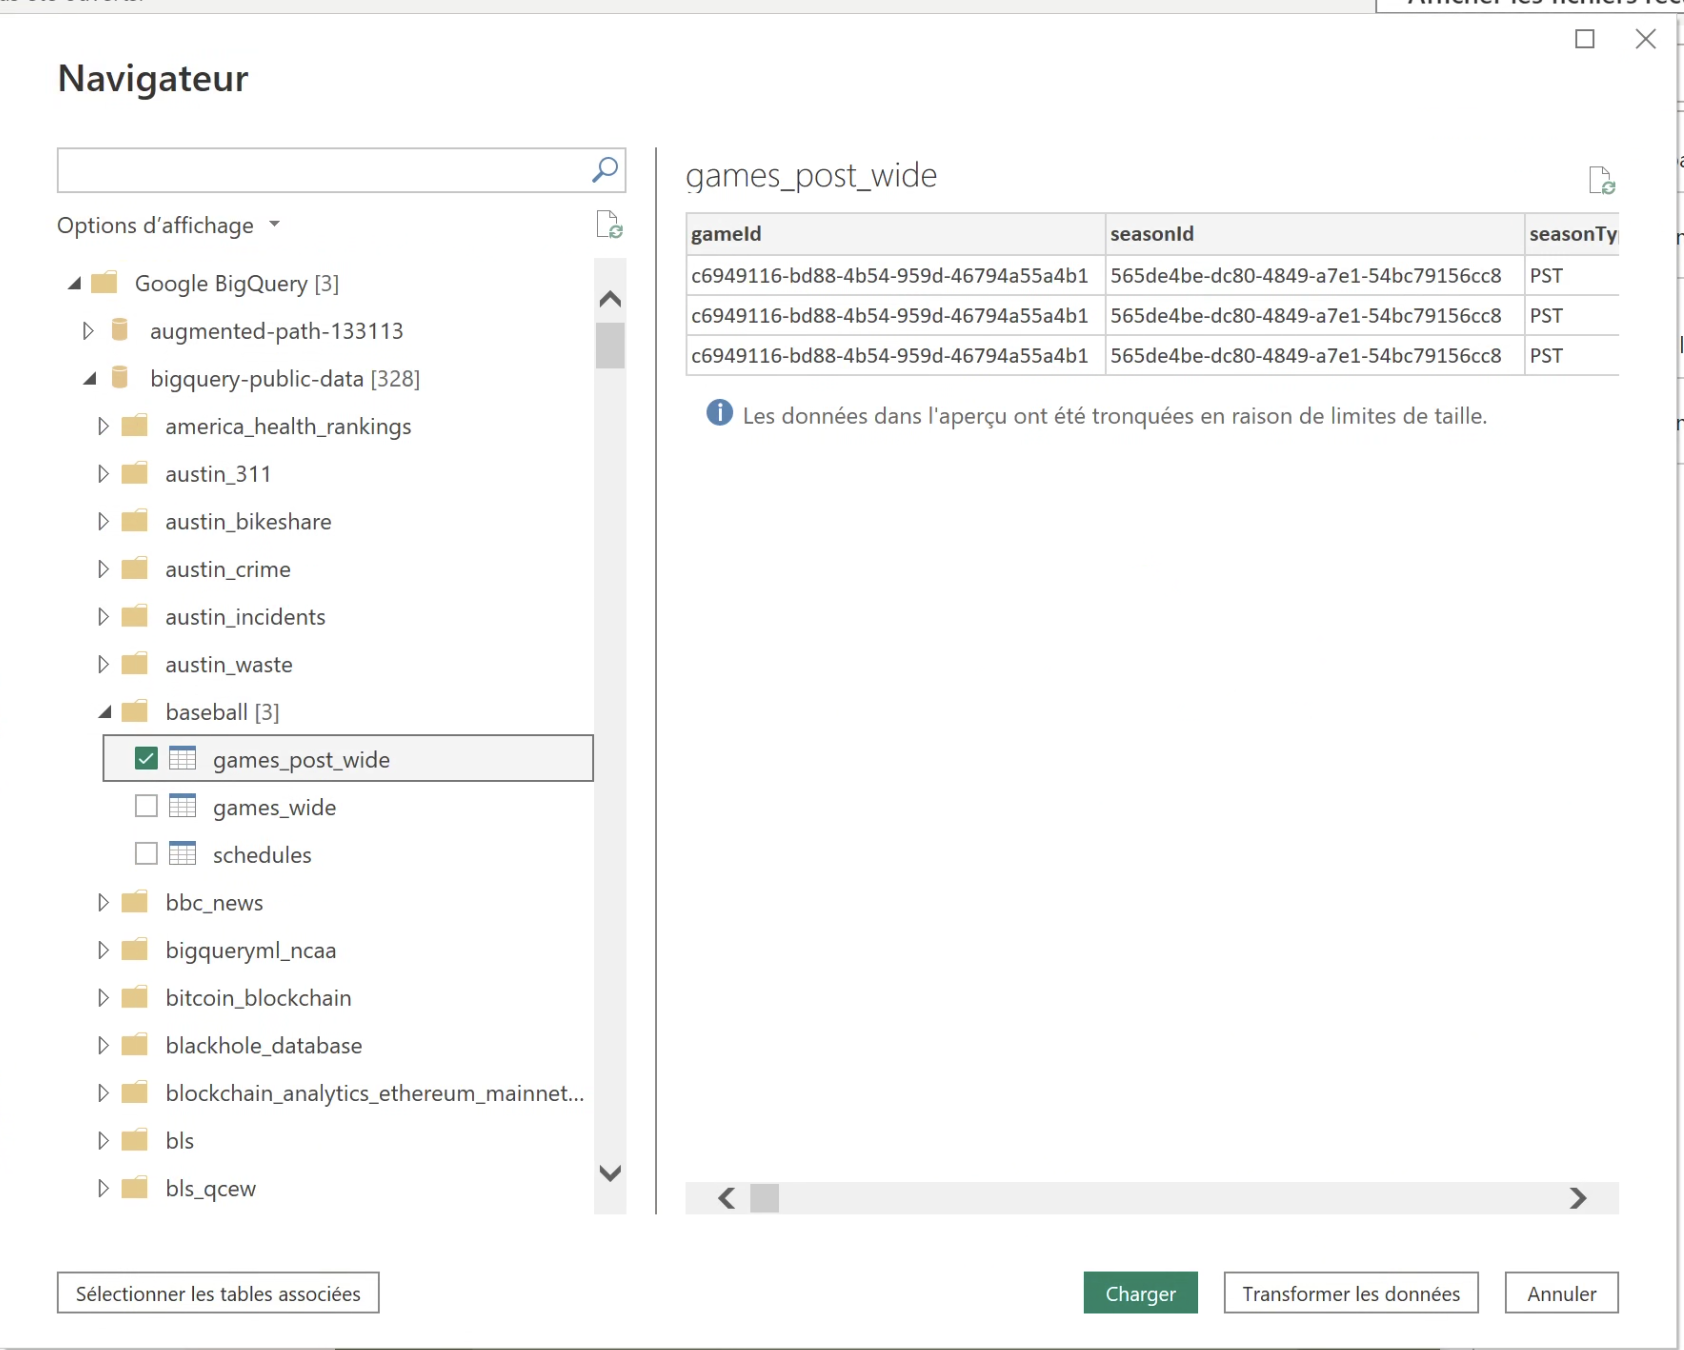
3. Connect your Google account and all your datasets and tables will appear :
It’s as easy as that to connect to Bigquery, but you’ll need to work on your analytics data to use them efficiently.
After connecting your GA4 properties to Bigquery, you have to create SQL queries to dig into your data and select your needed informations by unnesting all the elements. We will try to write a blog article on that soon to help you.
Pros
More customizable than the two others
Really good connection and fast update
No Limitation
Cons
Need some data preparation work before
Requiers good SQL skills or a larger data team.
Thanks for your reading.